Qlik® Sense
Qlik® Sense
|
Introducing Qlik Sense – Unleash Your Intuition Imagine an analytics tool so intuitive, anyone in your company could easily create personalized reports and dynamic dashboards to explore vast amounts of data and find meaningful insights. That’s Qlik Sense – a revolutionary self-service data visualization and discovery application designed for individuals, groups and organizations. Sense™ lets you rapidly create visualizations, explore data deeply, reveal connections instantly, and see opportunities from every angle. Give it a try today, download Qlik Sense Desktop demo for free now or watch demo video.
|

Interactive data discovery and visualization let your instinct lead the way
Sense makes visual dashboard creation simple and intuitive, but doesn’t stop there. Sense also makes it easy to explore the data so you can understand what’s happening and why. Ask questions. Follow your intuition. Seamlessly navigate vast amounts of data from multiple sources. Then share your insights visually and accurately knowing the analysis, commentary and content are based on reliable, governed data.

Drag-and-drop visualizations reveal hidden insights
Smart Visualizations in combination with the patented Qlik data indexing engine uncover all the relationships between data dimensions, revealing insights that would have been hidden in traditional hierarchical, query-based data models.

Smart Search gives you ultimate flexibility
Not sure where to begin looking? No problem. Simply type in search strings so Smart Search can connect the dots, uncovering data relationships and information in places you didn’t think to look, prompting you along the way.

Explore multiple data sources in a single app
Sense connects to multiple data sources to provide more comprehensive views, without compromising performance.

Access analytics anywhere, anytime, on any device
Solve problems on the go. Move seamlessly from desktop to tablet to smartphone, while Sense automatically adapts to the device. Wherever work may take you, Sense helps you respond in real time and keep ideas in motion.
Rich data storytelling helps you collaborate and share insights
Our data storytelling functionality makes it easier to share analysis visually, communicate your findings with teams, and collaborate more efficiently.
Rich data storytelling helps you collaborate and share insights
Our data storytelling functionality makes it easier to share analysis visually, communicate your findings with teams, and collaborate more efficiently.

Governed data enables self-service simplicity
Any user can create their own data visualizations, dashboards, and reports while giving IT confidence that they’re drawing upon consistent, secure libraries and governed data.
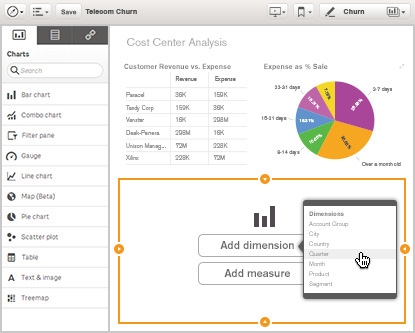
Anyone can easily create personalized data visualizations, reports and dashboards
With Sense, users at any level can bring their insights to life – no scripting required.
- Drag-and-drop techniques allow anyone to create compelling visualizations
- Built-in library lets you share and reuse of data, metrics and objects
- Progressive creation lets you keep it as simple – or sophisticated – as you like
Governed, enterprise-class technology provides centralized control with no tradeoffs
Finding a balance between the needs of business and IT has always been a challenge. But Sense is data visualization software that was designed to serve them equally: business users get total flexibility and agility while your IT team maintains centralized control and governance.

Governed, User-Driven Creation
Business users need to be able to explore data and answer questions on demand without waiting on IT to create or update their visualization apps. But data needs to be secure, consistent and trusted-and Sense provides robust governance to make this all possible.
Shared Object Library: Pre-built data, expressions and visualizations ensure consistent use of data and values.
Progressive Creation: Allows you to grant users additional access to create their own visualizations, sheets and stories as their skill set increases.
Managed Data Connections: Ensure all applications use common data sources without needing hard-coded database connections within the visualization app. Access is controlled by security rules.
Best-of-Breed, Rapid App Development
Sense delivers value in less time by giving developers a faster way to give business users access to data visualization and exploration capabilities.
Rapid Development Environment: Easy-to-use interface enables developers to create data visualization apps, including drag-and-drop techniques and collaborative development.
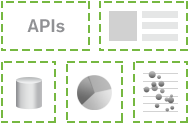
Powerful Open and Standard APIs: Give you the ability to embed Sense into web pages and custom applications, and extend core capabilities to meet custom needs.
Multi-source data integration including big data: Bring together data from disparate systems – including big data sources from across an organization – to provide a complete view and access to deeper insights.
Enterprise-Class Architecture
Sense was designed with the enterprise in mind, providing sophisticated, centralized control and scalability.
Manageability: Features flexible license allocation, usage monitoring, and an easy-to-use interface that saves time and simplifies troubleshooting.
Security: Implement enterprise-level security requirements with a flexible security-rules engine, granular control for progressive development, plus powerful audit and logging.
Scalability: Support for virtualization, elastic scaling and geographically disperse clustering enables global deployments.